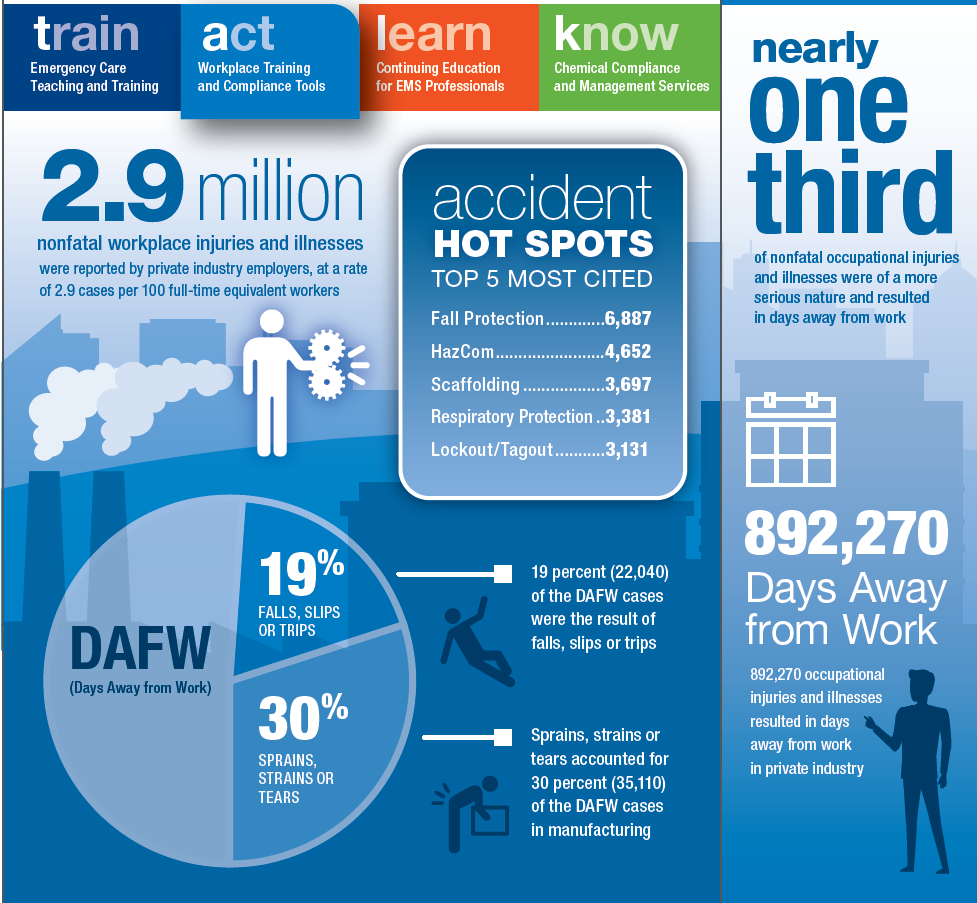
Currently, our safety manager posts monthly data about injuries as just raw data. In it's current format, nobody reads it. I want to do more than just bar charts as well. I would like to develop more of an infographic that gets posted. I think it is much more engaging for employees. I am wondering if anyone has created something like that, that you are willing to share. Something more like this -
------------------------------
Brian Frank
VP/CFO
Johnson Machine Works, Inc.
Chariton IA
(641) 217-2121
------------------------------